

Microsoft Excel is a powerful spreadsheet software application that enables users to create, manage, analyze, and visualize data in tabular form, facilitating various tasks, calculations, and operations related to data management, analysis, reporting, and presentation. Here's an overview of MS Excel basics:
1. Interface and Navigation:
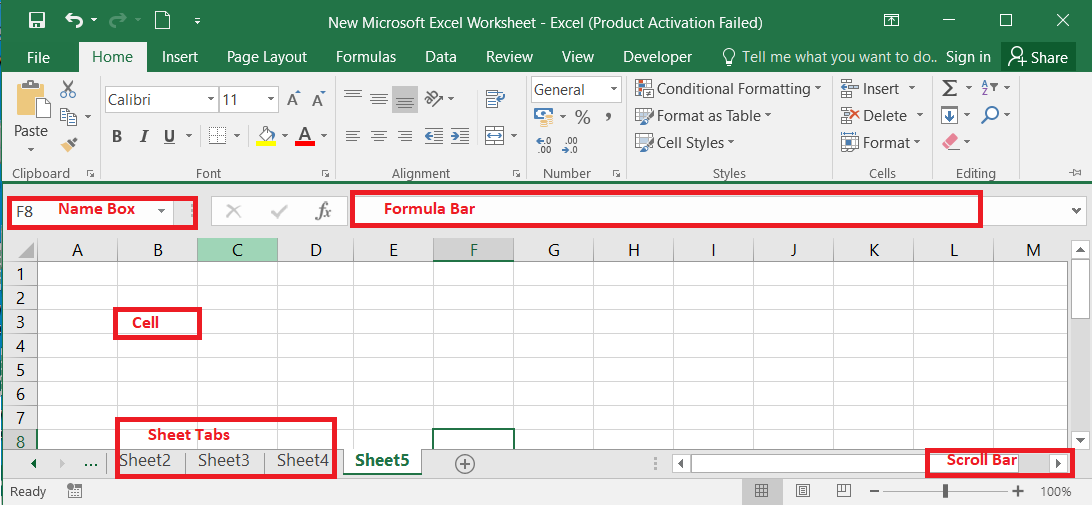
Ribbon: The Ribbon at the top of the Excel window contains tabs, such as "Home," "Insert," "Formulas," "Data," "Review," and more, which group related commands, functions, tools, and options for worksheet management, data analysis, formatting, and operations.
Worksheet and Workbook: Excel workbooks consist of multiple worksheets (tabs at the bottom), where users can input, organize, and manipulate data, perform calculations, and create charts, graphs, and visualizations.
2. Data Entry and Formatting:
Entering Data: Users can enter text, numbers, dates, formulas, and functions into cells, rows, and columns in the worksheet, creating tables, lists, and datasets for various applications and purposes.
Formatting Cells: Excel offers extensive formatting options for cells, including font styles, sizes, colors, borders, alignment, number formats, and cell styles, enabling users to customize and enhance the appearance, readability, and presentation of data and content.
3. Formulas and Functions:
Basic Formulas: Excel supports a wide range of basic mathematical, statistical, and logical formulas, such as addition, subtraction, multiplication, division, averages, sums, counts, percentages, and more, facilitating data calculations, analysis, and computations.
Functions: Excel provides built-in functions, such as SUM, AVERAGE, MIN, MAX, IF, VLOOKUP, COUNTIF, and many more, enabling users to perform complex calculations, data analysis, data manipulation, and specialized operations with ease and efficiency.
4. Data Analysis and Visualization:
Charts and Graphs: Excel offers various chart types, including column charts, bar charts, line charts, pie charts, scatter plots, and more, enabling users to create visual representations, graphs, and charts to visualize data, trends, patterns, and insights, facilitating data analysis, interpretation, and presentation.
PivotTables: PivotTables are powerful data analysis tools in Excel that enable users to summarize, analyze, and explore large datasets, create interactive tables, generate insights, and perform multi-dimensional analysis and reporting by organizing, aggregating, and presenting data in a structured and dynamic format.
5. Data Management and Operations:
Sorting and Filtering: Excel allows users to sort data, filter data, and apply conditional formatting, enabling data organization, analysis, and visualization based on specific criteria, conditions, or attributes, facilitating data management, exploration, and insights generation.
Data Validation and Protection: Excel offers data validation features to control data entry, ensure data accuracy, and maintain data consistency, and provides data protection tools, such as password protection, worksheet protection, and workbook protection, to secure, safeguard, and control access to data, worksheets, and workbooks.
6. Collaboration and Integration:
Sharing and Collaboration: Excel supports sharing and collaboration features, enabling multiple users to co-author, edit, review, and collaborate on workbooks in real-time using Excel Online, OneDrive, or SharePoint, and facilitates data integration, connectivity, and interoperability with other Microsoft Office applications and external data sources.

Either way the teacher or student will get the solution to the problem within 24 hours.